Help:DataVisualizationInCytoscape
From WikiPathways
(removed ClueGO) |
(→Data import and mapping) |
||
| Line 26: | Line 26: | ||
=== Download the data === | === Download the data === | ||
| - | For this tutorial, we will use an example dataset | + | For this tutorial, we will use an example dataset describing intestinal changes in response to fasting. The data is in the form of a text file. |
| - | The experimental data for this tutorial can be found here: [ | + | The experimental data for this tutorial can be found here: [need new link]. |
| - | === | + | === Open pathways === |
| - | + | ||
| - | + | ||
| - | + | Open relevant pathways via WP app and create a new pathway collection...... | |
=== Identifier mapping with BridgeDb === | === Identifier mapping with BridgeDb === | ||
| - | Since the data is annotated with | + | Since the data is annotated with Ensembl identifiers and the pathways have a mix of identifiers, the pathways need to be mapped to Ensembl before the data can be visualized. The BridgeDb app does exactly this, given a mapping file. Before performing the mapping, we have to import the appropriate mapping file to BridegDb. |
* Open the BridgeDb app under '''Apps > BridegDb > Manage ID Mapping Resources'''. | * Open the BridgeDb app under '''Apps > BridegDb > Manage ID Mapping Resources'''. | ||
| Line 53: | Line 51: | ||
* In the '''Base URL of BridgeDb web service''' drop-down, select the entry for mouse. Click '''OK''' to continue. | * In the '''Base URL of BridgeDb web service''' drop-down, select the entry for mouse. Click '''OK''' to continue. | ||
| - | You will see a listing of supported ID systems | + | You will see a listing of supported ID systems. We are now ready to perform the mapping. |
[[Image:BridgeDb_Config.png|left|]]<br clear="all" /> | [[Image:BridgeDb_Config.png|left|]]<br clear="all" /> | ||
| Line 59: | Line 57: | ||
* Close the '''ID Mapping Source Configuration''' interface. | * Close the '''ID Mapping Source Configuration''' interface. | ||
* Select '''Apps > BridegDb > Map Identifiers'''. | * Select '''Apps > BridegDb > Map Identifiers'''. | ||
| + | |||
| + | ......map identifiers | ||
| + | |||
| + | === Data import === | ||
| + | * To import the experimental data, select '''File > Import > Table > File...'''. Select the ''starvation_dataset_trans.txt'' file and click '''Open'''. | ||
| + | * Select the pathway collection created earlier to import the data to...... | ||
| + | * Select the appropriate key column...... | ||
| + | |||
| + | [[image:DataImport.png|left|]]<br clear="all" /> | ||
= Viewing data on pathways = | = Viewing data on pathways = | ||
Revision as of 21:41, 8 January 2016
UNDER CONSTRUCTION
This tutorial describes how to visualize experimental data on WikiPathways in Cytoscape. After importing the data, it is mapped to standard identifiers using BridgeDb. A visual style is created, and the data is visualized on pathways imported from WikiPathways.
Contents[hide] |
Installation
Cytoscape
- Download Cytoscape here: http://www.cytoscape.org/.
- Launch Cytoscape
Cytoscape Apps
- In Cytoscape, open the App Manager under Apps > App Manager.
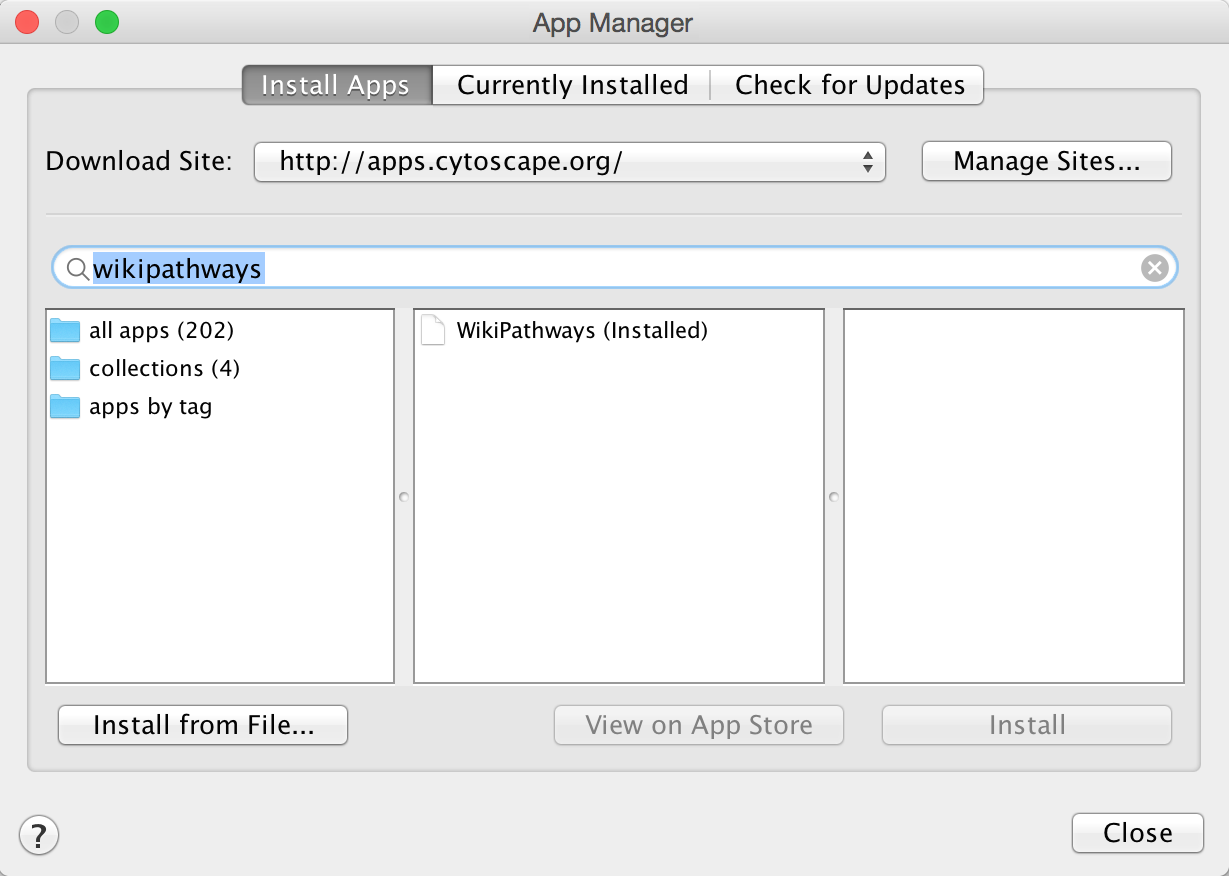
- In the search field, type WikiPathways to search for the WikiPathways app. In the search results, select the WikiPathways app and click Install.
- Next, find and install the BridgeDb app in the same way. When the installation is complete, click Close to exit the App Manager.
Alternatively, Cytoscape apps can be installed directly from the Cytoscape App Store. If Cytoscape is open on your computer, you can click Install on the relevant app page, and the app will install.
Data import and mapping
Download the data
For this tutorial, we will use an example dataset describing intestinal changes in response to fasting. The data is in the form of a text file.
The experimental data for this tutorial can be found here: [need new link].
Open pathways
Open relevant pathways via WP app and create a new pathway collection......
Identifier mapping with BridgeDb
Since the data is annotated with Ensembl identifiers and the pathways have a mix of identifiers, the pathways need to be mapped to Ensembl before the data can be visualized. The BridgeDb app does exactly this, given a mapping file. Before performing the mapping, we have to import the appropriate mapping file to BridegDb.
- Open the BridgeDb app under Apps > BridegDb > Manage ID Mapping Resources.
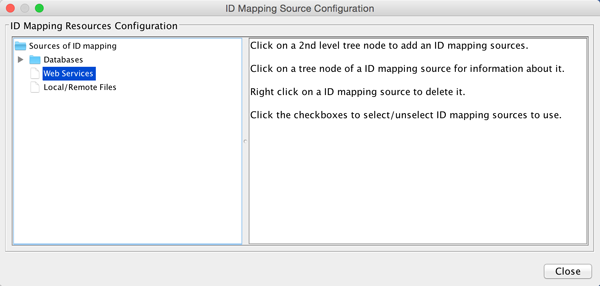
BridgeDb works with mapping information from various sources. For example, y ou can either download a database here, and after extracting it you can select it under Databases in the ID Mapping Resouces Configuration interface. You can also supply a local or remote mapping file. For this tutorial, we will use Web Services for the mappings.
- Click on the Web Services entry in the list of ID mapping sources.
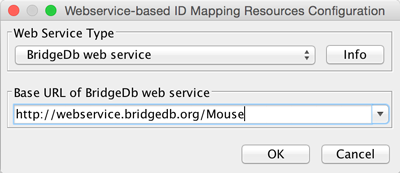
- In the Webservice-based ID Mapping Resources Configuration interface, select BridegDb web service in the drop-down.
- In the Base URL of BridgeDb web service drop-down, select the entry for mouse. Click OK to continue.
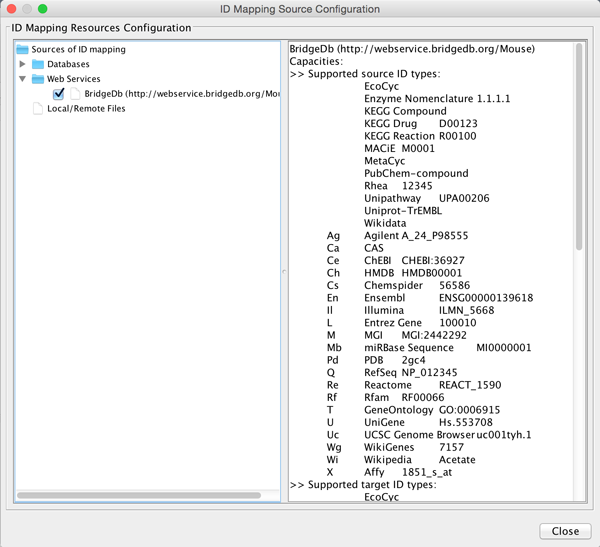
You will see a listing of supported ID systems. We are now ready to perform the mapping.
- Close the ID Mapping Source Configuration interface.
- Select Apps > BridegDb > Map Identifiers.
......map identifiers
Data import
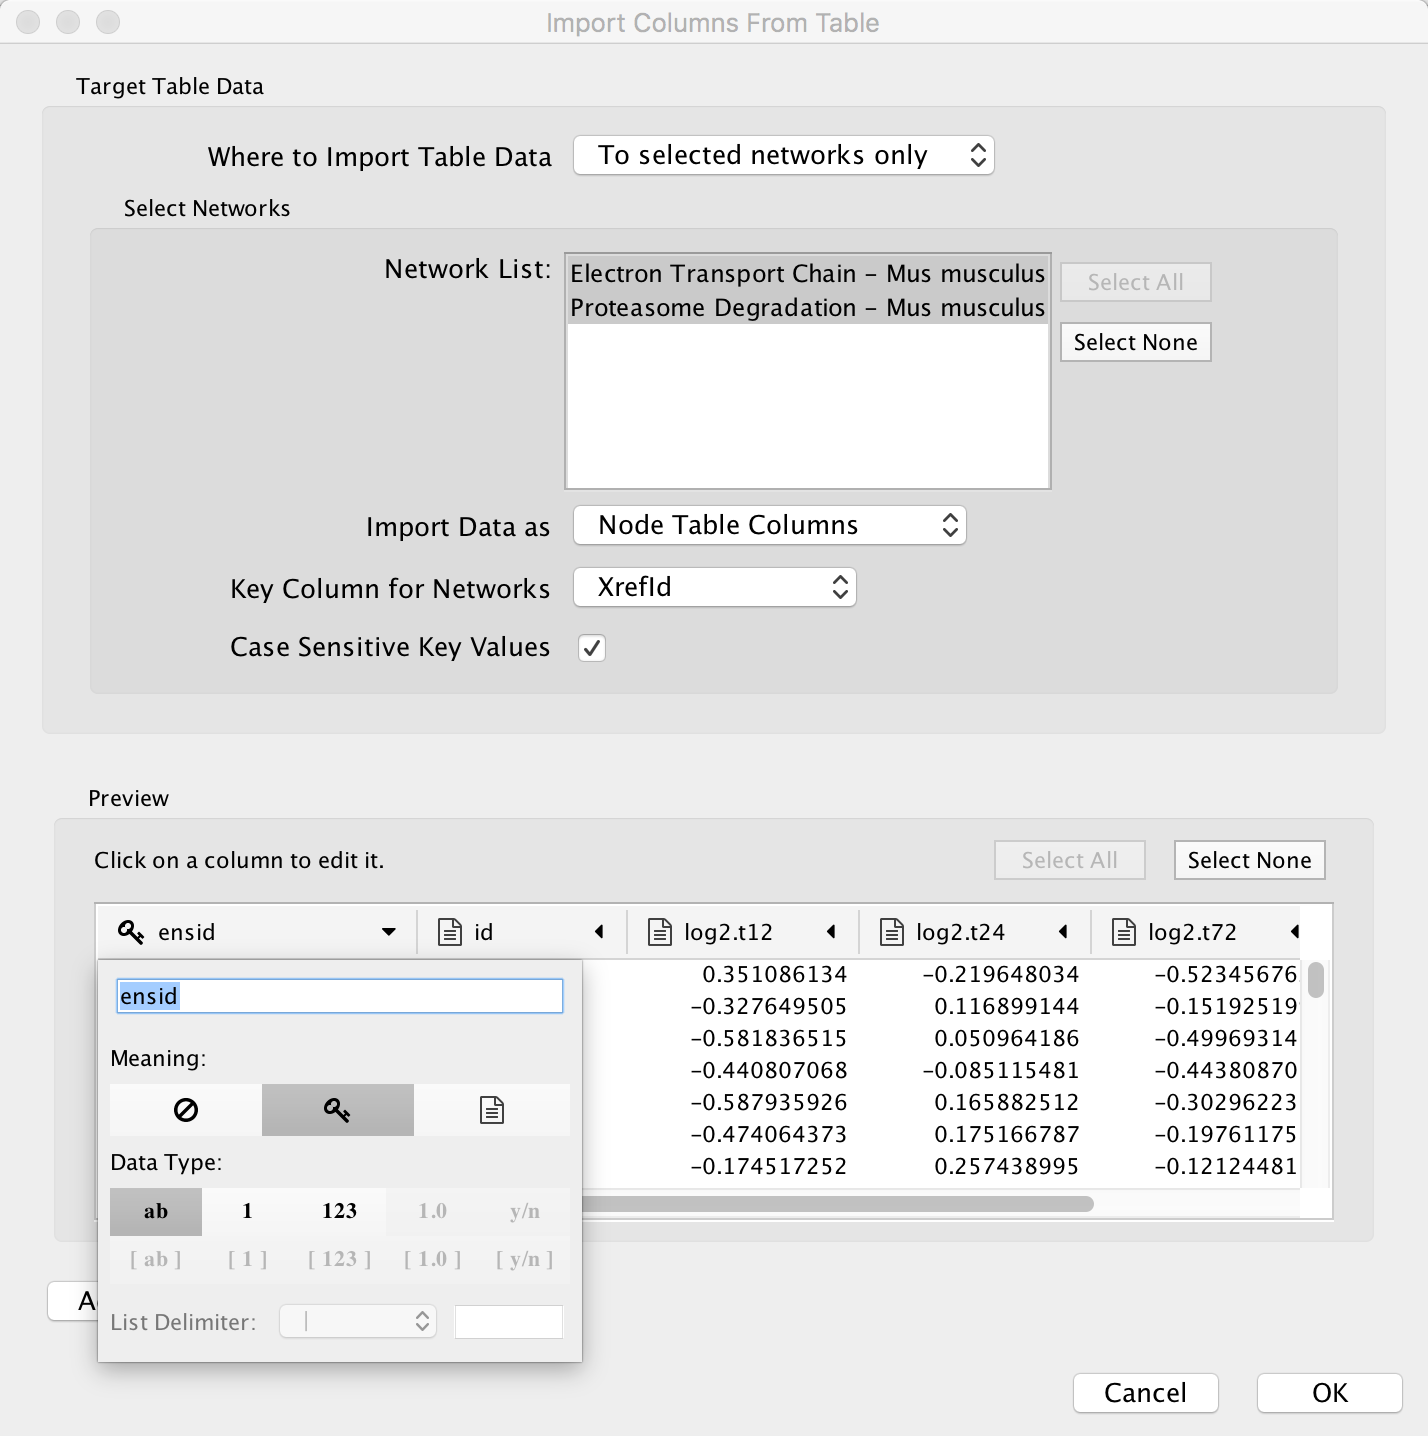
- To import the experimental data, select File > Import > Table > File.... Select the starvation_dataset_trans.txt file and click Open.
- Select the pathway collection created earlier to import the data to......
- Select the appropriate key column......
