Help:DataVisualizationInCytoscape
From WikiPathways
UNDER CONSTRUCTION
This tutorial describes how to visualize experimental data on WikiPathways in Cytoscape. After importing the data, it is mapped to Ensembl identifiers using BridgeDb. A visual style is created, and the data is visualized on pathways imported from WikiPathways. Finally, over-representation analysis is done with the ClueGO app.
Contents |
Installation
Cytoscape
- Download Cytoscape here: http://www.cytoscape.org/.
- Launch Cytoscape
WikiPathways and BiNGO Apps
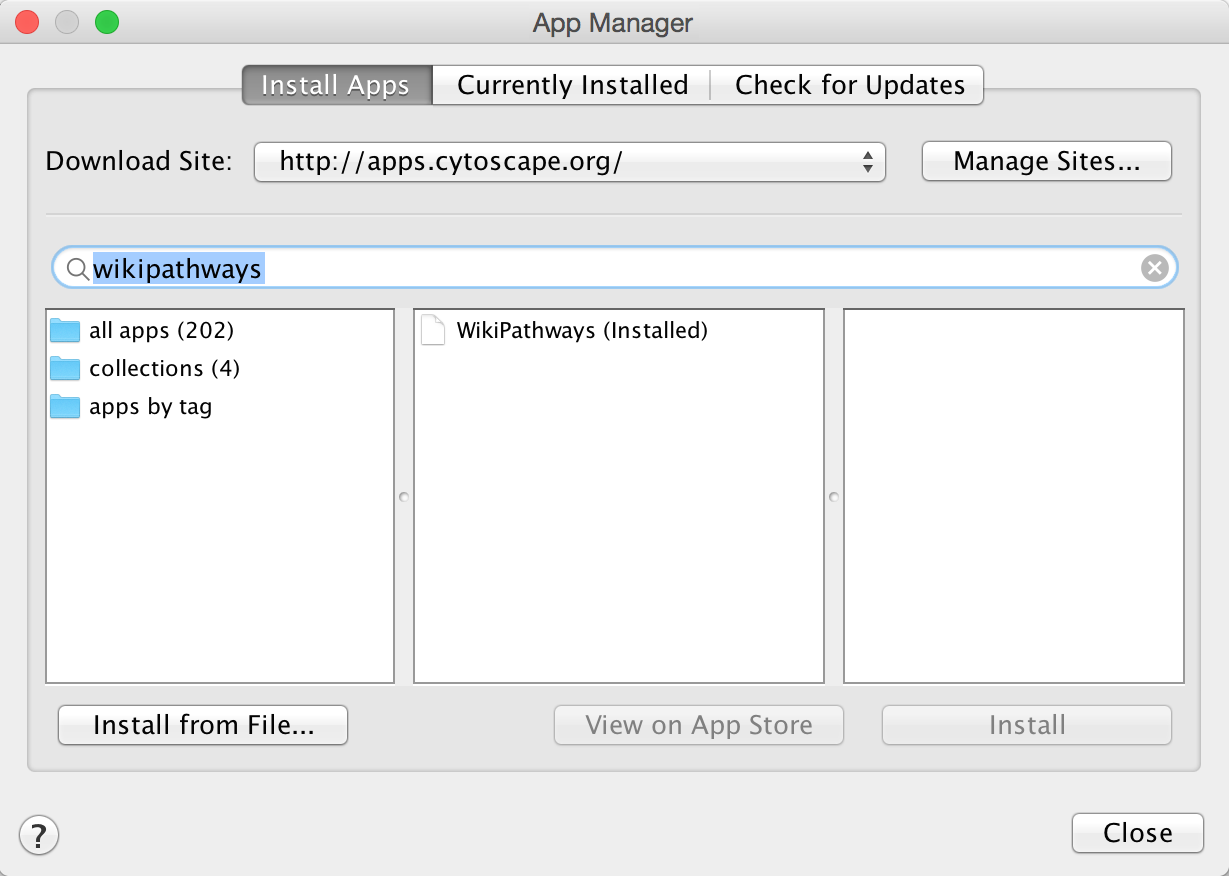
- In Cytoscape, open the App Manager under Apps > App Manager.
- In the search field, type WikiPathways to search for the WikiPathways app. In the search results, select the WikiPathways app and click Install.
- Next, find and install the BridgeDb app in the same way.
- Repeat the process for the ClueGO app. When the installation is complete, click Close to exit the App Manager.
Alternatively, Cytoscape apps can be installed directly from the Cytoscape App Store. If Cytoscape is open on your computer, you can click Install on the relevant app page, and the app will install.
Data import and mapping
Download the data
For this tutorial, we will use an example dataset of transcriptional profiling of mouse embryonic stem cells and embryoid bodies. The data is in the form of a text file.
The experimental data for this tutorial can be found here: MusMusculus_ES_EB.txt.
Data import
- To import the experimental data, select File > Import > Table > File.... Select the MusMusculus_ES_EB.txt file and click Open.
- Choose a name for the new data table, for example ES_EB. Click OK to import.


