Help:Guidelines EditorPalette
From WikiPathways
(→Data nodes) |
Current revision (19:12, 30 August 2021) (view source) m (Protected "Help:Guidelines EditorPalette" [edit=sysop:move=sysop]) |
||
| (117 intermediate revisions not shown.) | |||
| Line 1: | Line 1: | ||
| - | + | This guide describes the recommended utilization of the most commonly used elements of the WikiPathways editor palette. Examples are taken directly from the WikiPathways archives. If you have questions about specific cases, contact the [https://groups.google.com/forum/#!forum/wikipathways-discuss|WikiPathways discussion mailing list]. | |
| - | This guide describes the | + | |
| - | = Interactions = | + | For each figure, the original pathway is linked to from the image header. |
| + | |||
| + | = MIM Interactions - Molecular Interaction Maps = | ||
| + | The WikiPathways editor includes a set of MIM interaction types, based on the [http://discover.nci.nih.gov/mim/ Molecular Interaction Maps] notation. Refer to the [http://discover.nci.nih.gov/mim/formal_mim_spec.pdf formal MIM specification] for details on recommended usage. | ||
| - | |||
| - | |||
{|class="prettytable" | {|class="prettytable" | ||
|- | |- | ||
| - | ! | + | ![[Pathway:WP2272|Necessary stimulation]] |
| - | ! | + | ![[Pathway:WP58|Binding]] |
| - | ! | + | ![[Pathway:WP550|Conversion and Catalysis]] |
| - | ! | + | ![[Pathway:WP554|Inhibition]] |
|- | |- | ||
| - | |[[Image: | + | |[[Image:MIM-Necessary-Stimulation.png|border]] |
| - | |[[Image: | + | |[[Image:MIM-Binding.png|250px|border]] |
| - | |[[Image: | + | |[[Image:Arrow.png|border]] |
| - | |[[Image: | + | |[[Image:mim-inhibition.png|border|300px]] |
|} | |} | ||
| - | |||
| - | |||
| - | |||
{|class="prettytable" | {|class="prettytable" | ||
|- | |- | ||
| - | ! | + | ![[Pathway:WP1601|Stimulation]] |
| + | ![[Pathway:WP554|Transcription-Translation]] | ||
|- | |- | ||
| - | |[[Image: | + | |[[Image:MIM-Stimulation2.png|border|300px]] |
| + | |[[Image:Transcription.png|border|300px]] | ||
|} | |} | ||
| - | == | + | = Basic Interactions = |
| - | + | ||
| - | [[ | + | ==== Line / Arrow ==== |
| + | The solid line and arrow are used to denote a variety of processes when the more specific mim-interactions are not appropriate, including <b>translocation</b> and <b>activation</b>. | ||
| + | {|class="prettytable" | ||
| + | |- | ||
| + | ![[Pathway:WP428|Generic arrow]] | ||
| + | ![[Pathway:WP1603|Translocation between compartments]] | ||
| + | ![[Pathway:WP2059|Undefined process]] | ||
| + | |- | ||
| + | |[[Image:PlainArrow.png|border]] | ||
| + | |[[Image:Arrow_translocation.png|border]] | ||
| + | |[[Image:DashedArrow.png|border]] | ||
| + | |} | ||
==== Line types ==== | ==== Line types ==== | ||
| - | Any interaction can have a line style of either <i>straight</i>, <i>curved</i>, <i>elbow</i> or <i>segmented</i>. The default style is straight, and is shown in the examples above. The other three line styles are used | + | Any interaction can have a line style of either <i>straight</i>, <i>curved</i>, <i>elbow</i> or <i>segmented</i>. The default style is straight, and is shown in the examples above. The other three line styles are used to increase readability or to allow for a specific layout. |
{|class="prettytable" | {|class="prettytable" | ||
|- | |- | ||
| - | !Curved | + | ![[Pathway:WP690|Curved]] |
| - | !Elbow | + | ![[Pathway:WP197|Elbow]] |
| - | !Segmented | + | ![[Pathway:WP78|Segmented]] |
|- | |- | ||
| - | |[[Image:Curved.png]] | + | |[[Image:Curved.png|border]] |
| - | |[[Image: | + | |[[Image:Elbow.png|border|300px]] |
| - | |[[Image:Segmented.png]] | + | |[[Image:Segmented.png|border|300px]] |
|} | |} | ||
| - | = | + | = Data nodes = |
| - | The | + | * <b>GeneProduct</b>: The default data node, used for proteins, RNA and genes. |
| - | + | * <b>Metabolite</b>: Used for any metabolite, drug or small molecule. | |
| - | + | * <b>Pathway</b>: Used to denote a connection to another pathway. | |
| - | + | * <b>Protein</b>: Used specifically for proteins. | |
| - | + | * <b>RNA</b>: Used specifically for RNA, for example miRNA. | |
| - | + | ||
| - | + | ||
| - | + | ||
| - | + | ||
| - | + | ||
| - | + | ||
| + | {|class="prettytable" | ||
| + | |- | ||
| + | ![[Pathway:WP1246|GeneProduct]] | ||
| + | ![[Pathway:WP1531|Metabolite]] | ||
| + | ![[Pathway:WP78|Pathway]] | ||
| + | |- | ||
| + | |[[Image:GeneProduct.png|border]] | ||
| + | |[[Image:Metabolite.png|border]] | ||
| + | |[[Image:Pathway.png|border]] | ||
| + | |} | ||
| - | |||
| - | |||
| - | |||
| - | |||
| - | |||
| - | |||
| - | |||
| - | |||
| - | |||
| - | |||
| - | |||
| - | |||
| - | |||
| - | |||
| - | |||
| - | |||
{|class="prettytable" | {|class="prettytable" | ||
|- | |- | ||
| - | ! | + | ![[Pathway:WP1544|Protein]] |
| - | !RNA | + | ![[Pathway:WP608|RNA]] |
| - | + | ||
|- | |- | ||
| - | |[[Image: | + | |[[Image:Protein.png|border]] |
| - | |[[Image:DataNode-RNA.png | + | |[[Image:DataNode-RNA.png|border]] |
| - | + | ||
|} | |} | ||
= Graphical elements = | = Graphical elements = | ||
| + | |||
| + | Graphical elements are purely graphical, meaning they do not have a meaning in the network graph that defines nodes and interactions. | ||
==== Label ==== | ==== Label ==== | ||
| + | Labels are used to describe locations, entities, processes or context: | ||
| + | {|class="prettytable" | ||
| + | |- | ||
| + | ![[Pathway:WP1603|Labels used to indicate event]] | ||
| + | ![[Pathway:WP111|Labels used to describe complexes]] | ||
| + | |- | ||
| + | |[[Image:Label-event.png|border|350px]] | ||
| + | |[[Image:Label-complex.png|border]] | ||
| + | |} | ||
==== Line ==== | ==== Line ==== | ||
| + | Lines can be used to create more complicated graphical objects representing biological structures, or to create a pathway legend. | ||
| - | |||
| - | = | + | {|class="prettytable" |
| + | |- | ||
| + | ![[Pathway:WP2118|Multiple lines used to represent a sarcomere]] | ||
| + | ![[Pathway:WP339|Lines used to create a legend]] | ||
| + | |- | ||
| + | |[[Image:Line.png|border|450px]] | ||
| + | |[[Image:Legend.png|border]] | ||
| + | |} | ||
| - | = | + | ==== Arc ==== |
| + | The arc is typically used to denote a cellular or molecular structure. | ||
| - | |||
| + | {|class="prettytable" | ||
| + | |- | ||
| + | ![[Pathway:WP2118|Arcs used to represent a cellular structure]] | ||
| + | ![[Pathway:WP4249|Arcs used to represent an organelle]] | ||
| + | |- | ||
| + | |[[Image:Arc.png|border]] | ||
| + | |[[Image:Cilium.png|border]] | ||
| + | |} | ||
| - | ==== | + | ==== Rectangle ==== |
| + | The rectangle is typically used for headers, to create an outline for a legend or as a purely graphical object: | ||
| + | {|class="prettytable" | ||
| + | |- | ||
| + | ![[Pathway:WP509|Rectangle used as a header border]] | ||
| + | |- | ||
| + | |[[Image:Rectangle2.png|border]] | ||
| + | |} | ||
| - | ==== Vesicle | + | = Cellular compartments = |
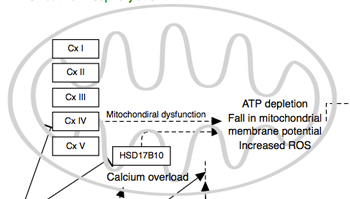
| + | Cellular compartment shapes are used to specify the cellular location of processes. Using the defined cellular compartment shapes instead of simple graphical shapes ensures that the cellular location information is encoded in the gpml. Use the "Text Label" property of the object 9in the Properties panel) to add a title, instead of adding a separate label. | ||
| + | {|class="prettytable" | ||
| + | |- | ||
| + | ![[Pathway:WP1531|Cell]] | ||
| + | ![[Pathway:WP1425|Nucleus]] | ||
| + | |- | ||
| + | |[[Image:Cell.png|border]] | ||
| + | |[[Image:Nucleus.png|border]] | ||
| + | |} | ||
| + | |||
| + | {|class="prettytable" | ||
| + | |- | ||
| + | ![[Pathway:WP1603|Vesicle]] | ||
| + | ![[Pathway:WP2059|Mitochondria]] | ||
| + | |- | ||
| + | |[[Image:Vesicle.png|border]] | ||
| + | |[[Image:Mitochondria.png|border]] | ||
| + | |} | ||
Current revision
This guide describes the recommended utilization of the most commonly used elements of the WikiPathways editor palette. Examples are taken directly from the WikiPathways archives. If you have questions about specific cases, contact the discussion mailing list.
For each figure, the original pathway is linked to from the image header.
Contents |
MIM Interactions - Molecular Interaction Maps
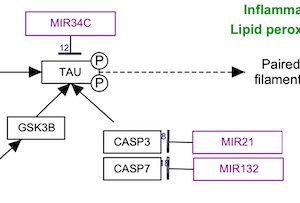
The WikiPathways editor includes a set of MIM interaction types, based on the Molecular Interaction Maps notation. Refer to the formal MIM specification for details on recommended usage.
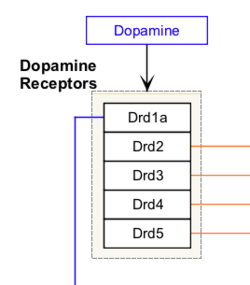
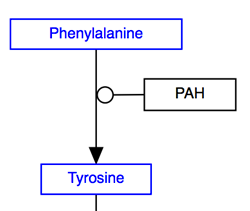
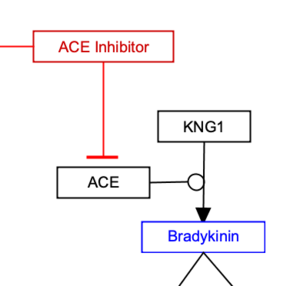
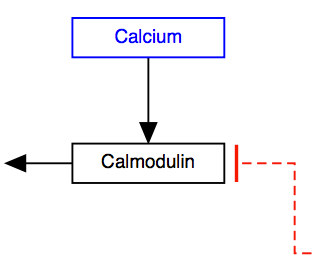
| Necessary stimulation | Binding | Conversion and Catalysis | Inhibition |
|---|---|---|---|

| 
| 
| 
|
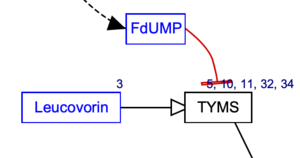
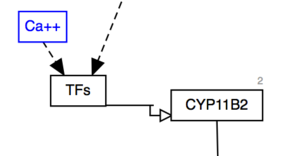
| Stimulation | Transcription-Translation |
|---|---|
| 
|
Basic Interactions
Line / Arrow
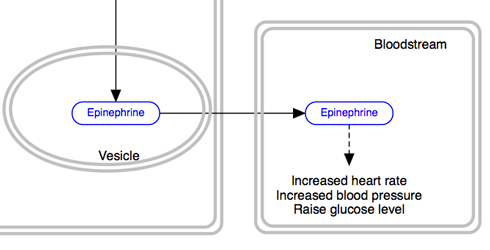
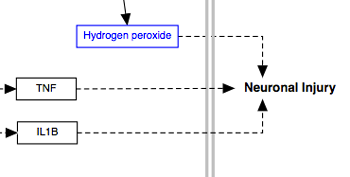
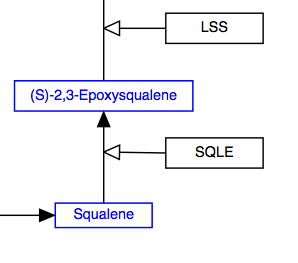
The solid line and arrow are used to denote a variety of processes when the more specific mim-interactions are not appropriate, including translocation and activation.
| Generic arrow | Translocation between compartments | Undefined process |
|---|---|---|
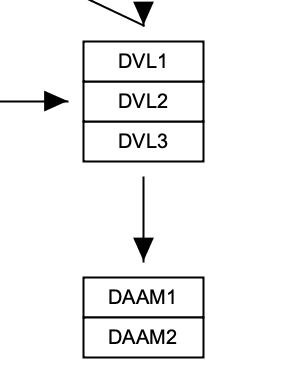
| 
| 
|
Line types
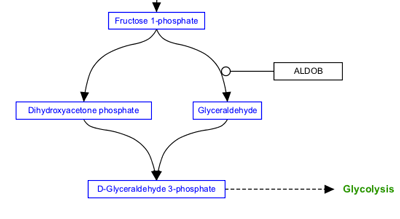
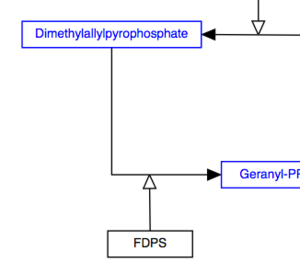
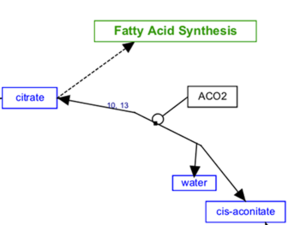
Any interaction can have a line style of either straight, curved, elbow or segmented. The default style is straight, and is shown in the examples above. The other three line styles are used to increase readability or to allow for a specific layout.
| Curved | Elbow | Segmented |
|---|---|---|
| 
| 
|
Data nodes
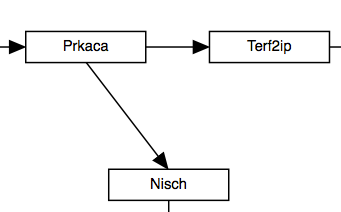
- GeneProduct: The default data node, used for proteins, RNA and genes.
- Metabolite: Used for any metabolite, drug or small molecule.
- Pathway: Used to denote a connection to another pathway.
- Protein: Used specifically for proteins.
- RNA: Used specifically for RNA, for example miRNA.
| GeneProduct | Metabolite | Pathway |
|---|---|---|
| 
| 
|
| Protein | RNA |
|---|---|
| 
|
Graphical elements
Graphical elements are purely graphical, meaning they do not have a meaning in the network graph that defines nodes and interactions.
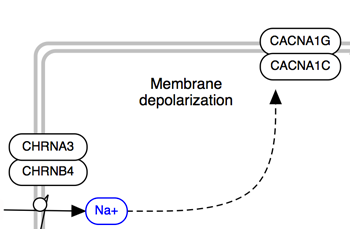
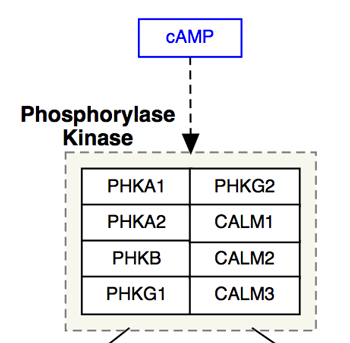
Label
Labels are used to describe locations, entities, processes or context:
| Labels used to indicate event | Labels used to describe complexes |
|---|---|
| 
|
Line
Lines can be used to create more complicated graphical objects representing biological structures, or to create a pathway legend.
| Multiple lines used to represent a sarcomere | Lines used to create a legend |
|---|---|

| 
|
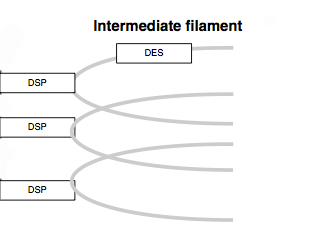
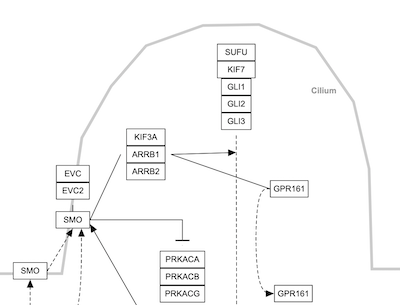
Arc
The arc is typically used to denote a cellular or molecular structure.
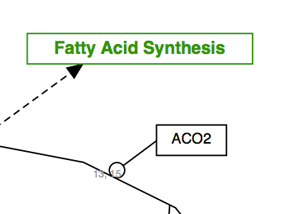
| Arcs used to represent a cellular structure | Arcs used to represent an organelle |
|---|---|
| 
|
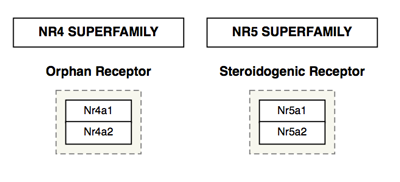
Rectangle
The rectangle is typically used for headers, to create an outline for a legend or as a purely graphical object:
| Rectangle used as a header border |
|---|
|
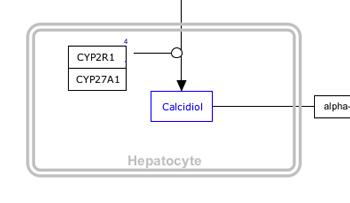
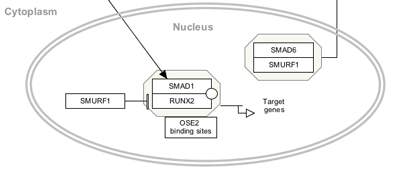
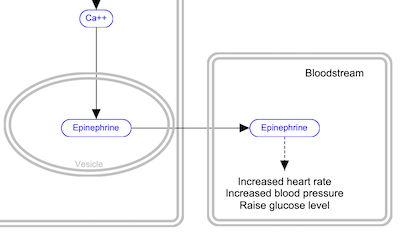
Cellular compartments
Cellular compartment shapes are used to specify the cellular location of processes. Using the defined cellular compartment shapes instead of simple graphical shapes ensures that the cellular location information is encoded in the gpml. Use the "Text Label" property of the object 9in the Properties panel) to add a title, instead of adding a separate label.
| Cell | Nucleus |
|---|---|
| 
|
| Vesicle | Mitochondria |
|---|---|
| 
|

